Neo4j Tutorial: Learn Cypher & Build Dashboards with Generative AI
- Xuebin Wei

- Feb 5
- 4 min read
In our previous tutorial, we walked through how to use Python to organize tweets and insert them into a free Neo4j database. We built a robust "knowledge graph" linking Users, Tweets, Hashtags, and Places.
But data sitting in a database isn't enough. To unlock its value, we need to ask it questions and visualize the answers.
In this Neo4j Tutorial, we are going to cover three key skills:
Learn the Basics of Cypher: The query language that powers graph databases.
Utilize Generative AI: How to use AI to write complex database queries for you.
Build a Dashboard: Create an interactive report to visualize tweet locations and hashtag connections.
Watch the full video tutorial here
Understanding the Graph Structure
Before writing queries, it is crucial to understand the "shape" of our data. Unlike a traditional table-based database (such as Excel or SQL), a graph database focuses on relationships.
Nodes: The entities in our data (Users, Tweets, Hashtags, Places).
Relationships: How they connect (e.g., A User: POSTED a Tweet).

Neo4j Tutorial Part 1: Mastering the Basics of Cypher
Cypher is the SQL of Graph Databases, but it is much more visual. It uses ASCII-art style syntax to represent patterns.
Defining Nodes
A node is defined by parentheses (). For example, to represent a User node, we use
(u:User)u is the alias (a nickname for the query).
: User is the label (the type of node).

Defining Relationships
Relationships are defined by square brackets [] and arrows -> to show direction. If we want to find a User who posted a Tweet, the pattern looks like this:
(u:User)-[:POSTED]->(t:Tweet)
Connecting Multiple Nodes
The real power of graph databases comes from chaining these connections. If we want to find specific topics, we can extend the pattern to see which hashtags were used in a tweet:
(u:User)-[:POSTED]->(t:Tweet)-[:TAGGED_WITH]->(h:Hashtag)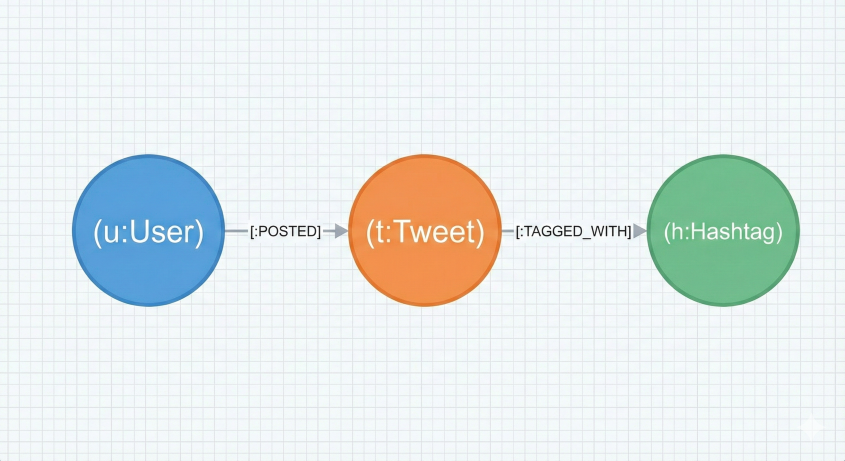
Using Generative AI to Write Queries
You don't need to memorize every single Cypher command. Neo4j now includes Generative AI tools that translate Plain English into code.
For example, if you want to find specific users interested in AI, you don't need to manually write the MATCH and WHERE clauses. You can simply open the AI query tool and type:
"Find the users who posted tweets containing the hashtag 'AI'."The AI generates the complex matching logic for you and automatically traverses relationships. This shifts your focus from coding to solution architecture.

Building an Interactive Dashboard
Finally, we turn our queries into a visual dashboard. A static report is useful, but an interactive one is powerful. We can use Neo4j's dashboard builder to visualize
geospatial data and network graphs.
Generating the Initial Dashboard
Instead of building charts one by one, we can ask the AI to build the initial layout.

Once generated, you might get a mix of bar charts, maps, and tables. You can drag and drop these "cards" to rearrange your view, remove the ones you don't need (such as pie charts), and resize the ones you do (such as the map).

Adding Interactivity with Parameters
To make the dashboard truly useful, we added filters (parameters). Instead of hard-coding "New York" or "#Python," we set up dynamic filters.
Place Filter: We created a selector that uses the Place label. This allows the viewer to pick a specific city.

Connecting the Query: We modified the Cypher query to check if the filter is active. If a city is selected, the map updates to show only that city; if not, it shows everything.
We asked the AI to: "Return the tweets based on the place where the name equals this parameter ($place_name). If this one is null, return all tweets."
The resulting Cypher logic looks something like this:
WHERE (p.name = $place_name OR $place_name IS NULL)This logic ensures that if you select "New York," the map filters down. But if you clear the selection (setting the parameter to null), the map defaults to showing all locations.


We repeated this process for Hashtags, creating a network graph that redraws itself to show only the users discussing a specific topic.
Conclusion: The Modern Data Stack
We have gone from raw data to a fully functional, filtered dashboard without writing thousands of lines of code. This demonstrates the power of the modern data stack:
Understand the Logic: You define the structure (Nodes and Relationships).
Guide the AI: You use natural language to request specific insights.
Visualize the Result: You build tools that allow others to explore the data.
If you haven't set up your database yet, be sure to check out our previous guide on building the Knowledge Graph with Python to get started!


Comments